- 移动端


北京隆福佳生物科技有限公司代理商
8 年
手机商铺
商家活跃:
产品热度:
- NaN
- 0.8999999999999999
- 0.8999999999999999
- 2.9
- 2.9

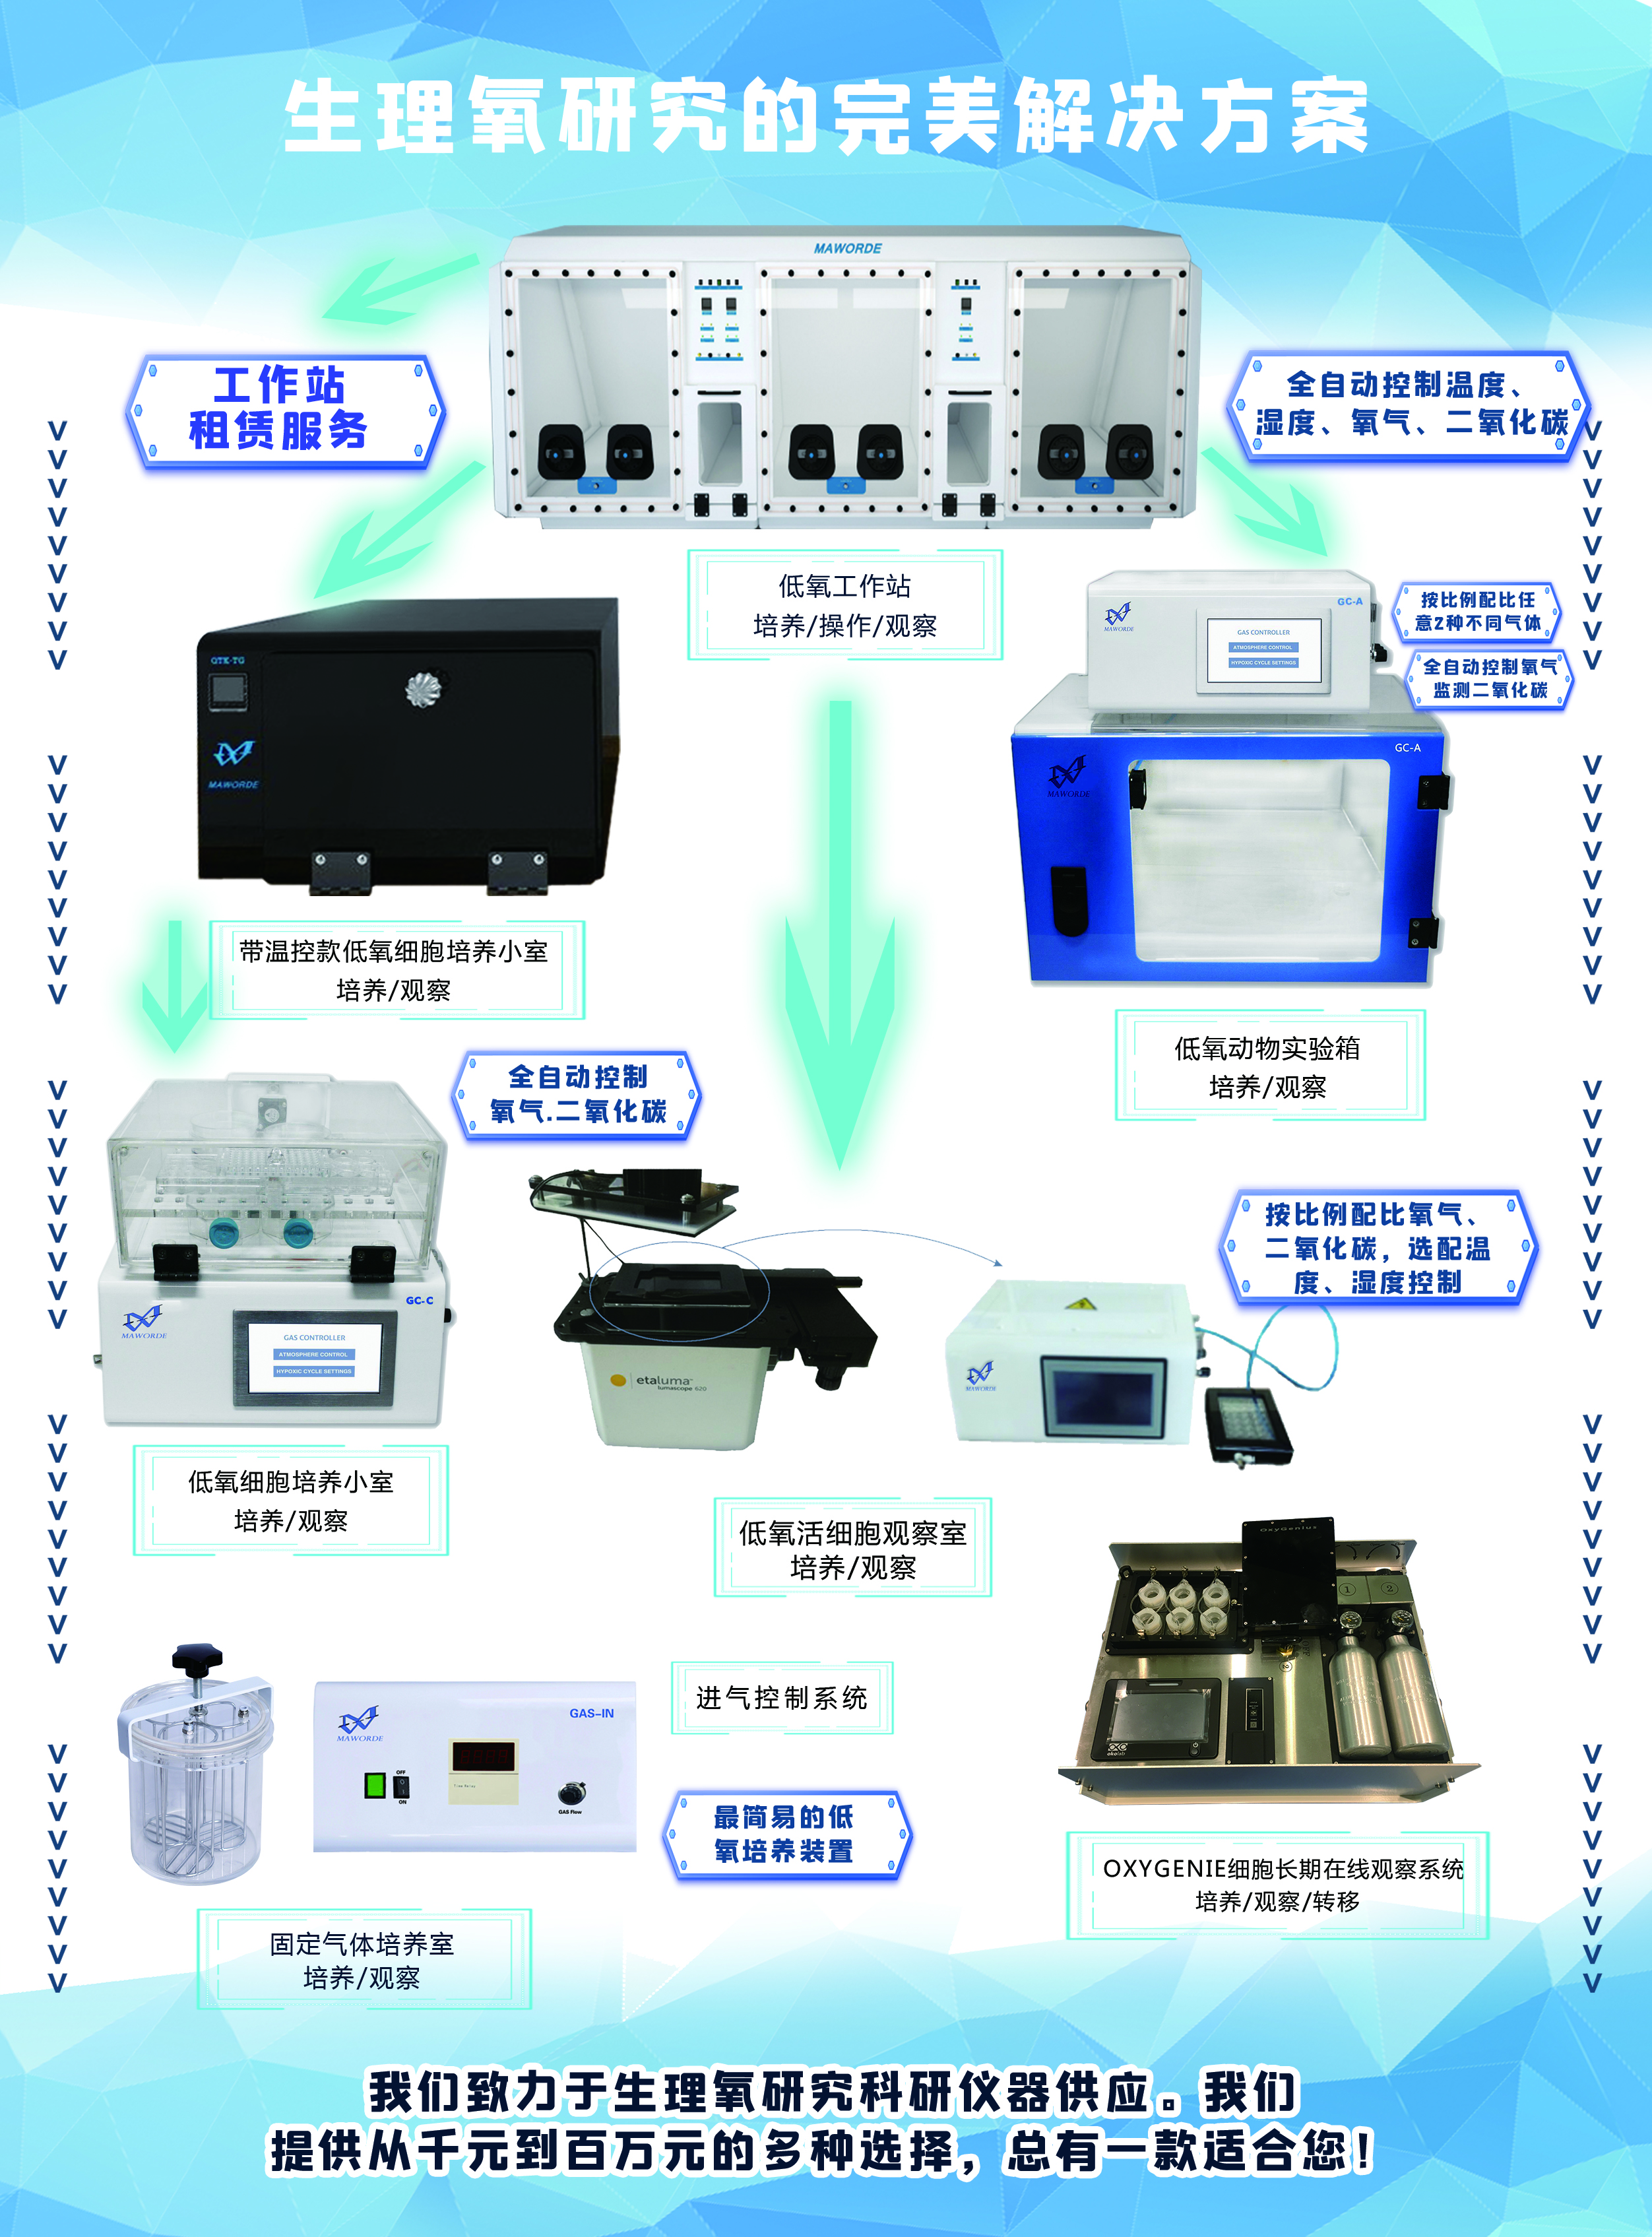
为鱼类低氧研究定制的低氧工作站
询价
代理商
北京隆福佳生物科技有限公司
入驻年限:8 年
- 联系人:
纪小姐
- 所在地区:
北京 石景山区
- 业务范围:
技术服务、实验室仪器 / 设备、细胞库 / 细胞培养、试剂、ELISA 试剂盒、抗体、耗材、论文服务、医疗器械
- 经营模式:
经销商 代理商
推荐产品


公司新闻/正文
Ruskinn低氧工作站细胞免疫治疗领域研究——低氧条件下CD8+T细胞向分泌IL-10、增殖能力差的效应细胞的表型转换
639 人阅读发布时间:2020-09-27 10:52
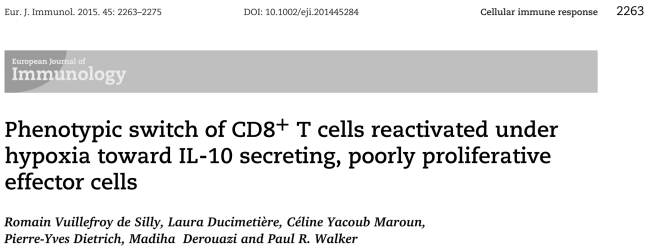
图1:日内瓦大学医学院;工作站及气体使用情况:In Vivo2 300
主要内容:在体内CD8+T细胞在氧分压较低的地方发挥作用,故了解缺氧对CD8+T细胞影响是预测体内免疫功能的重要一步。分别在体外模拟生理氧和病理氧分压对CD8+T细胞重新激活和分化过程中的作用研究发现,与在大气氧含量(21% O2)下产生的CTL相比,在5% O2(对应于淋巴结中的生理氧)下产生的效应信号更高;低氧(1% O2)不会改变细胞毒性,但随着O2降低会依赖性地降低细胞增殖,诱导免疫抑制细胞因子IL‐10的分泌,并上调CD137和CD25的表达。
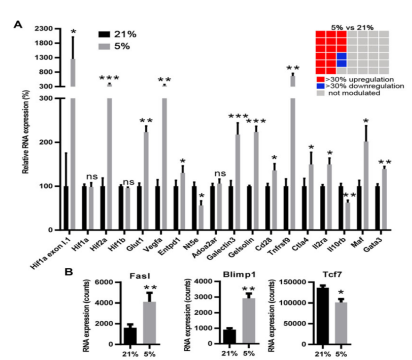
图2: CTLs generated under physioxia have a higher effector profile than those generated under atmospheric oxygen fraction. (A and B) CTLs from Pmel-1 splenocytes were generated under 21% (black bars) or 5% O2 (gray bars) and were analyzed for RNA expression. Results represent (A) the mean relative gene expression or (B) the RNA absolute count + SEM of five independent experiments (n = 5). The checkerboard represents the 42 genes analyzed (only genes modulated by more than 30% with a p < 0.05 are colored in red or blue).
对一组42个基因与低氧、免疫功能或参与细胞生存的基因进行研究发现,一些与CD8+ T细胞存活和扩张正相关的基因被上调,包括gata3、il2ra和cd28;与细胞凋亡增加和免疫调节5相关的maf和ctla4也被上调。在空气中氧浓度状态下产生的CLT表现出更高的效应,blimp1和fasl的上调和tcf7的下调可以证明这一点。
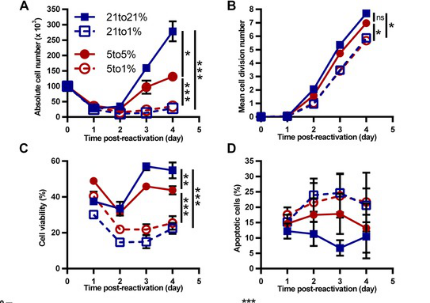
图3: Hypoxia modulates expansion and RNA profile of reactivated CTLs. CTLs generated under 21% (squares) or 5% (circles) O2 from Pmel-1 splenocytes were reactivated for indicated times under 21% O2 (closed squares with solid line), 5% O2 (closed circles with solid line) or 1% O2 (open squares or open circles with dashed line). Results show (A) mean cell number, (B) mean cell division number, (C) mean cell viability, and (D) mean apoptotic cells ± SEM out of at least three independent experiments (n≥3). CTLs generated under (E) 21% or (F) 5% O2 from Pmel-1 splenocytes were reactivated for two days under indicated oxygen fractions. (E) RNA profile from CTLs reactivated under 21% (black bars) or 1% O2(gray bars). (F) RNA profile from CTLs reactivated under 5% (black histograms) or 1% O2 (gray histograms). Results represent the mean relative gene expression+ SEM out of four independent experiments (n = 4). The checkerboard represents the 42 genes analyzed (only genes modulated by more than 30% with ap < 0.05 are colored in red or blue). To display common genes modulated under each condition, genes composing the checkerboard are organized identically (in an arbitrary fashion). ns: not statistically significant, *p < 0.05, **p < 0.01, *** p <0.001 (A–D: Student’s t-test; E, F: Three-way ANOVA)
21% O2和在5% O2下产生的CTL,分别在原氧气浓度和和1%O2下重新激活;1%O2重新激活的CTL平均细胞数、平均细胞分裂数和平均细胞存活率均显著低于原始浓度下重新激活的CTL;1%O2重新激活的CTL平均凋亡细胞数著高于原始浓度下重新激活的CTL;综上,低氧使重新激活后的CTL扩增显著降低。